点击关注公众号,实用技术文章及时了解
Spring Boot 工程集成 Micrometer
引入依赖
配置
监控jvm信息
创建自定义监控
添加具体业务代码监控
集成 Prometheus
安装
集成配置
使用 Grafana Dashboard 展示监控项
安装grafana
配置prometheus数据源
增加jvm面板
配置业务接口监控面板
1.Spring Boot 工程集成 Micrometer
1.1引入依赖
org.springframework.boot spring-boot-starter-actuator
io.micrometer micrometer-registry-prometheus
1.2配置
management.server.port=9003
management.endpoints.web.exposure.include=*
management.endpoint.metrics.enabled=true
management.endpoint.health.show-details=always
management.endpoint.health.probes.enabled=true
management.endpoint.prometheus.enabled=true
management.metrics.export.prometheus.enabled=true
management.metrics.tags.application=voice-qc-backend
这里 management.endpoints.web.exposure.include=* 配置为开启 Actuator 服务,因为Spring Boot Actuator 会自动配置一个 URL 为 /actuator/Prometheus 的 HTTP 服务来供 Prometheus 抓取数据,不过默认该服务是关闭的,该配置将打开所有的 Actuator 服务。
management.metrics.tags.application 配置会将该工程应用名称添加到计量器注册表的 tag 中去,方便后边 Prometheus 根据应用名称来区分不同的服务。
1.3监控jvm信息
然后在工程启动主类中添加 Bean 如下来监控 JVM 性能指标信息:
@SpringBootApplication
public class GatewayDatumApplication {public static void main(String[] args) {SpringApplication.run(GatewayDatumApplication.class, args);}@BeanMeterRegistryCustomizer configurer(@Value("${spring.application.name}") String applicationName) {return (registry) -> registry.config().commonTags("application", applicationName);}}
1.4创建自定义监控
监控请求次数与响应时间
package com.lianxin.gobot.api.monitor;import io.micrometer.core.instrument.Counter;
import io.micrometer.core.instrument.MeterRegistry;
import io.micrometer.core.instrument.Timer;
import lombok.Getter;
import org.springframework.beans.factory.annotation.Autowired;
import org.springframework.beans.factory.annotation.Value;
import org.springframework.stereotype.Component;import javax.annotation.PostConstruct;/*** @Author: GZ* @CreateTime: 2022-08-30  10:50* @Description: 自定义监控服务* @Version: 1.0*/
@Component
public class PrometheusCustomMonitor {/*** 上报拨打请求次数*/@Getterprivate Counter reportDialRequestCount;/*** 上报拨打URL*/@Value("${lx.call-result-report.url}")private String callReportUrl;/*** 上报拨打响应时间*/@Getterprivate Timer reportDialResponseTime;@Getterprivate final MeterRegistry registry;@Autowiredpublic PrometheusCustomMonitor(MeterRegistry registry) {this.registry = registry;}@PostConstructprivate void init() {reportDialRequestCount = registry.counter("go_api_report_dial_request_count", "url",callReportUrl);reportDialResponseTime=  registry.timer("go_api_report_dial_response_time", "url",callReportUrl);}
}
1.5添加具体业务代码监控
//统计请求次数
prometheusCustomMonitor.getReportDialRequestCount().increment();
long startTime = System.currentTimeMillis();
String company = HttpUtils.post(companyUrl,"");
//统计响应时间
long endTime = System.currentTimeMillis();
prometheusCustomMonitor.getReportDialResponseTime().record(endTime-startTime, TimeUnit.MILLISECONDS);
在浏览器访问 http://127.0.0.1:9001/actuator/prometheus ,就可以看到服务的一系列不同类型 metrics 信息,例如jvm_memory_used_bytes gauge、jvm_gc_memory_promoted_bytes_total counter ,go_api_report_dial_request_count等
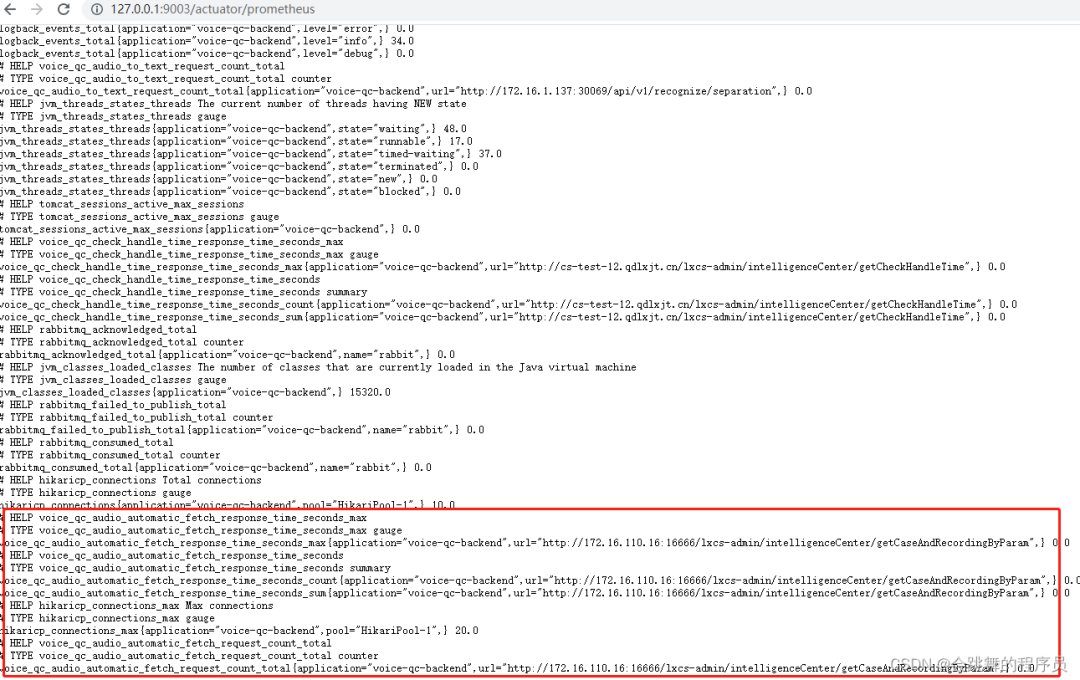
到此,Spring Boot 工程集成 Micrometer 就已经完成,接下里就要与 Prometheus 进行集成了。
2.集成 Prometheus
2.1安装
docker pull prom/prometheusmdkir /usr/local/prometheusvi prometheus.yml# my global config
global:scrape_interval: 15s # Set the scrape interval to every 15 seconds. Default is every 1 minute.evaluation_interval: 15s # Evaluate rules every 15 seconds. The default is every 1 minute.# scrape_timeout is set to the global default (10s).# Alertmanager configuration
alerting:alertmanagers:- static_configs:- targets:# - alertmanager:9093# Load rules once and periodically evaluate them according to the global 'evaluation_interval'.
rule_files:# - "first_rules.yml"# - "second_rules.yml"# A scrape configuration containing exactly one endpoint to scrape:
# Here it's Prometheus itself.
scrape_configs:# The job name is added as a label `job=` to any timeseries scraped from this config.- job_name: 'prometheus'# metrics_path defaults to '/metrics'# scheme defaults to 'http'.static_configs:- targets: ['192.168.136.129:9090'] docker run -d --name prometheus -p 9090:9090 -v/usr/local/prometheus/prometheus.yml:/etc/prometheus/prometheus.yml prom/prometheus
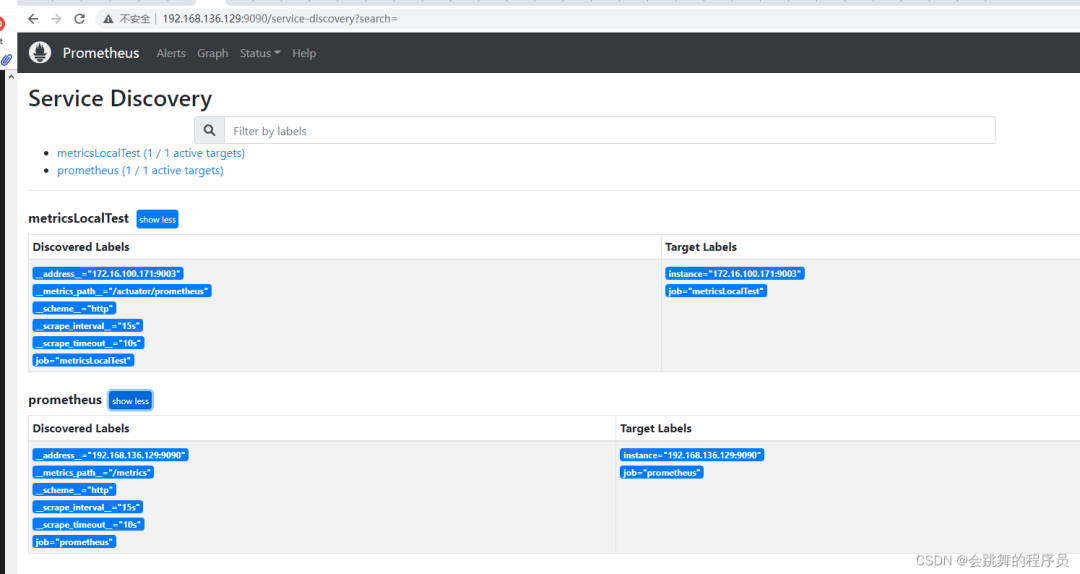
2.2集成配置
global:scrape_interval: 15sscrape_configs:- job_name: "prometheus"static_configs:- targets: ["localhost:9090"]- job_name: "metricsLocalTest"metrics_path: "/actuator/prometheus"static_configs:- targets: ["localhost:9003"]这里 localhost:9001 就是上边本地启动的服务地址,也就是 Prometheus 要监控的服务地址。同时可以添加一些与应用相关的标签,方便后期执行 PromSQL 查询语句区分。最后重启 Prometheus 服务
3.使用 Grafana Dashboard 展示监控项
3.1安装grafana
docker pull grafana/grafanadocker run -d --name grafana -p 3000:3000 -v /usr/local/grafana:/var/lib/grafana grafana/grafana默认用户名/密码 admin/admin
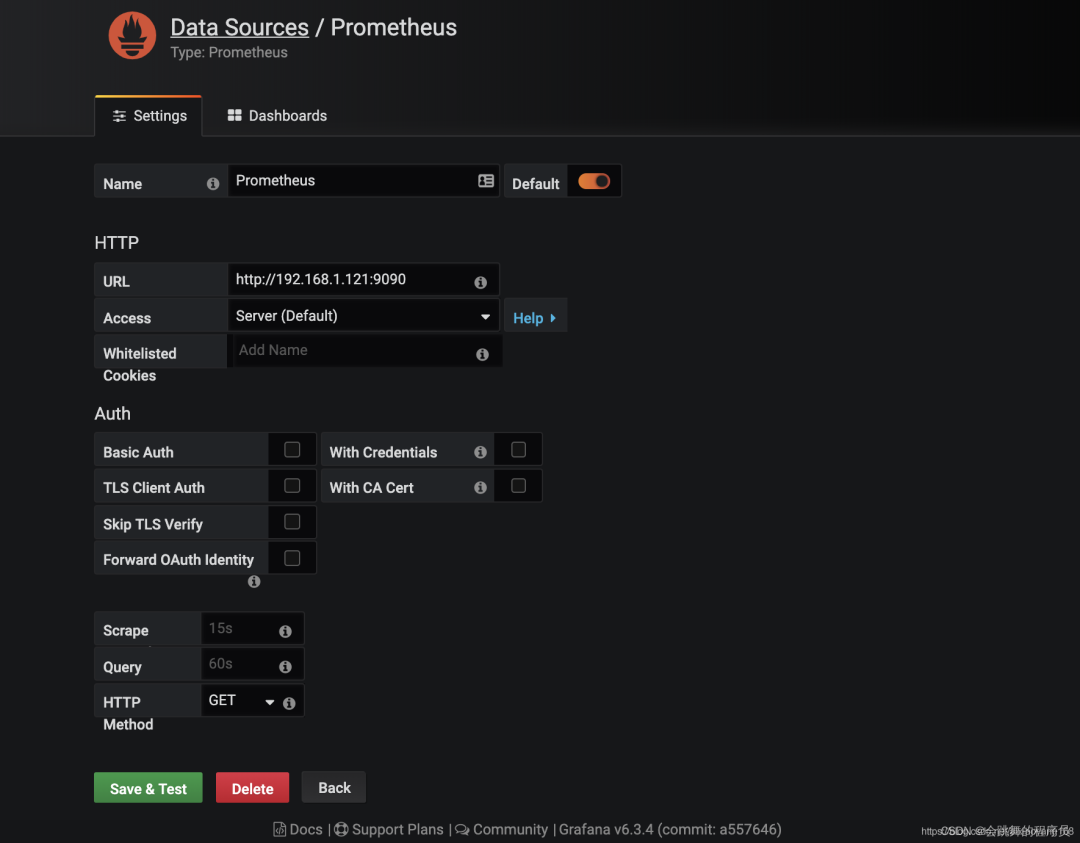
3.2配置prometheus数据源
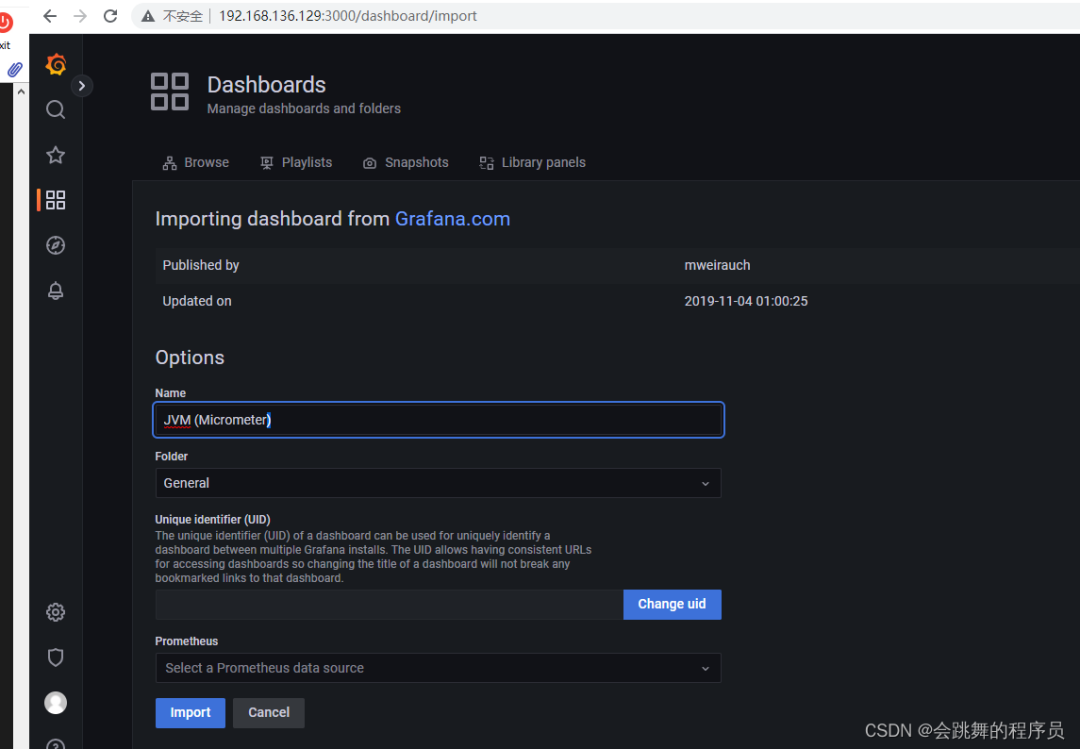
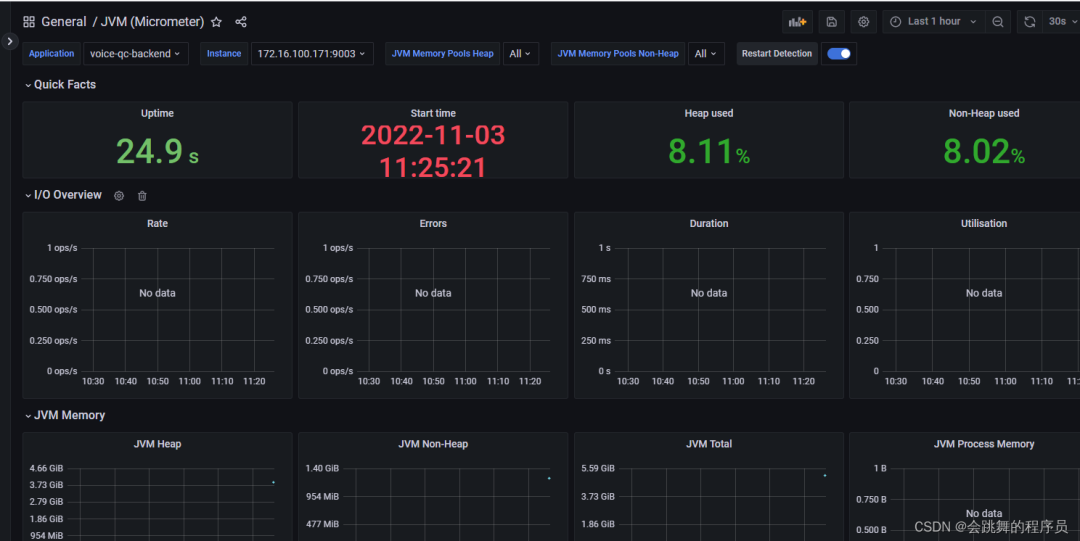
3.3增加jvm面板
模板编号为4701
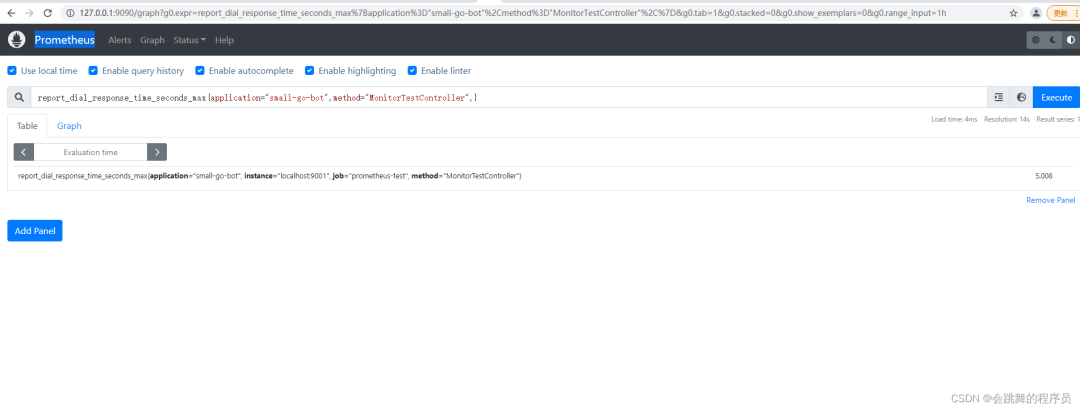
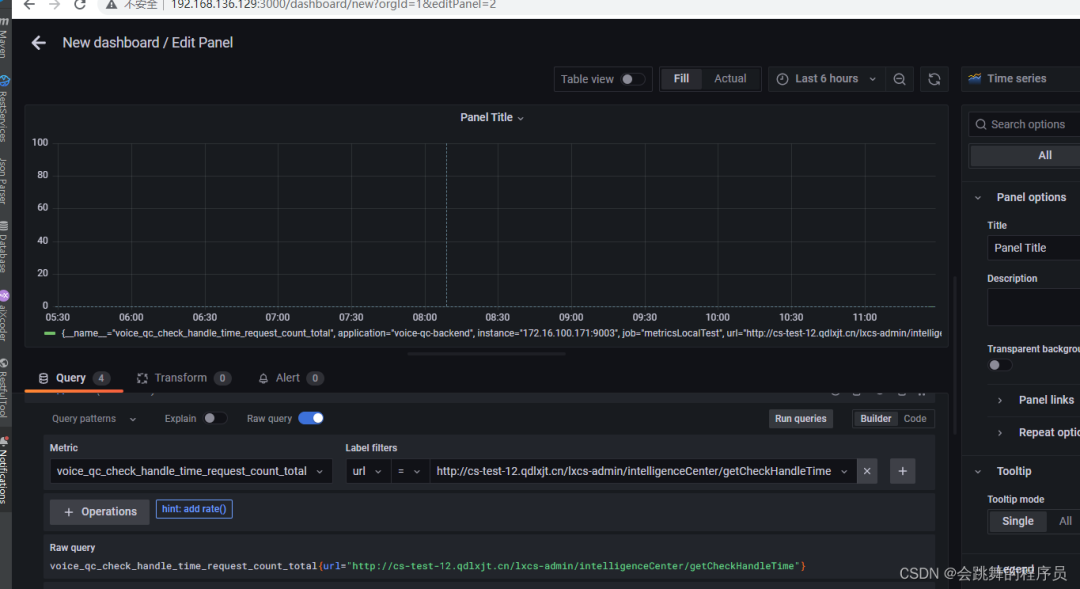
3.4配置业务接口监控面板
感谢阅读,希望对你有所帮助 :)
来源:blog.csdn.net/GZ946/article/details/126619218
推荐
Java面试题宝典
技术内卷群,一起来学习!!PS:因为公众号平台更改了推送规则,如果不想错过内容,记得读完点一下“在看”,加个“星标”,这样每次新文章推送才会第一时间出现在你的订阅列表里。点“在看”支持我们吧!